Calculating the True Cost of Premium Leakage: A Loss Ratio Breakdown by Risk Factor
The industry-level number for premium leakage — somewhere between $29 and $36 billion a year — is big enough to get someone’s attention but too abstract to actually do anything with.
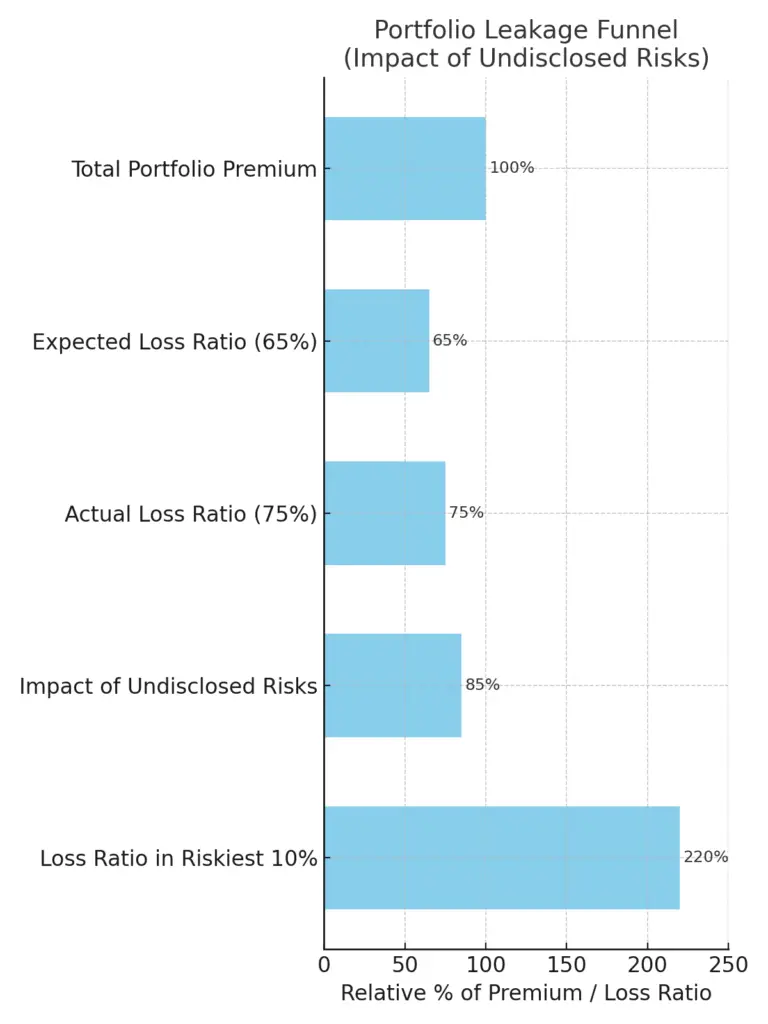
What’s more useful is understanding where the losses concentrate. Because premium leakage isn’t evenly distributed across a book. The riskiest 10% of policyholders often account for a disproportionate share of total losses — and within that group, the ones carrying undisclosed risk factors are the ones quietly draining profitability.
The question worth asking isn’t “how much does premium leakage cost the industry?” It’s “which undisclosed factors have the highest loss ratio impact when they’re missed — and how much worse does it get when they go undetected?”
Here’s the breakdown, ranked by impact.
Loss-Ratio Impact by Undisclosed Risk Factor
(Loss ratio lift measured as how much actual claims cost exceeds the priced premium when the risk factor goes undisclosed.)
| Rank | Factor | Estimated Loss-Ratio Lift When Undisclosed | Why It’s So Risky |
| 1 | Undisclosed Commercial/Rideshare Use | +250–400% | Vehicles in commercial/rideshare service have ~2–3× frequency and higher severity but are often rated as personal-use if undisclosed. |
| 2 | Undisclosed Regular High-Risk Driver (teen, inexperienced, suspended) | +200–350% | Adds another high-frequency driver without premium to cover them. Loss frequency spikes, especially for teens (3×–4× higher). |
| 3 | Garaging Location Misrepresentation | +150–300% | Inner-city garaging increases theft and collision risk sharply. Loss frequency can more than double compared to rural/suburban addresses. |
| 4 | Annual Mileage Understatement | +100–200% | Frequency risk rises sharply after 12–15k miles/year. Understating mileage is common and can push true exposure far above priced assumption. |
| 5 | Driver Behavior Not Captured in MVR (aggressive driving, phone use) | +80–180% | Telematics data shows aggressive drivers have ~60–70% higher frequency even with clean MVRs. Big hidden cost until crash occurs. |
| 6 | Vehicle Modifications (performance upgrades) | +80–150% | Performance enhancements increase both frequency (reckless driving) and severity (higher repair costs, greater injury risk). |
| 7 | Prior Claims History from Other Lines Not Considered | +50–120% | Loss-prone behavior in boats, motorcycles, or commercial vehicles often carries over but isn’t priced into personal auto. |
| 8 | Undisclosed Medical/Physical Limitations | +40–80% | Certain conditions increase crash risk but are hard to underwrite without medical disclosure; regulators limit pricing on health factors. |
Breaking Down the Biggest Offenders
Undisclosed Commercial and Rideshare Use
The rideshare era created a leakage category that didn’t meaningfully exist before. A driver who picks up rides for Uber or Lyft — even part-time — is operating their vehicle in a commercial capacity that personal lines rates don’t cover. The frequency of miles driven, the number of passengers, the hours of operation: all of it shifts the risk profile significantly.
The challenge is that this misrepresentation often isn’t malicious. Many drivers genuinely don’t understand that their personal auto policy doesn’t cover rideshare activity. But the loss ratio impact when these vehicles appear in claims is among the highest of any undisclosed factor — 250 to 400% above the priced assumption.
Undisclosed High-Risk Drivers
A policy that covers a household with a 17-year-old driver — or someone with a recent DUI, multiple at-fault accidents, or a suspended license — priced as a single-driver policy is one of the more straightforward leakage patterns carriers see. The hidden driver is almost always the highest-risk person in the household; that’s frequently why they’re hidden.
By the way, 75% of undisclosed drivers that surface in claims are high-risk. That’s not a coincidence — it’s the signal that the behavior of removing a driver during an application is itself predictive of the driver’s risk profile.
Verisk data puts hidden drivers at 12% of standard policies and 15% of nonstandard policies. Those policies have loss ratios more than double the average.
Garaging Location
Garaging misrepresentation might be the most systematic of the premium leakage categories because it’s easy to do, hard to catch, and geographically concentrated. Verisk estimates that garaging address errors appear in more than 10% of policies — and that in Miami alone, garaging misrepresentation costs carriers $32.5 million annually in lost premiums.
Inner-city and high-density territory ratings exist because theft, collision frequency, and repair costs are genuinely higher in those areas. An applicant who lists a suburban address for a car that lives in a city garage creates a persistent mismatch between the priced risk and the actual exposure.
Mileage Understatement
Over $5 billion in annual premium leakage traces back to underreported mileage. The math is simple: frequency risk rises sharply once a vehicle passes 12–15,000 miles per year. An applicant who reports 8,000 miles when they’re actually driving 18,000 isn’t just mildly underreporting — they’re in a materially different risk tier.
The digital application made this easier. The mileage field has no friction, no verification, and the premium difference is visible in real time. Sixteen percent of consumers in a 2012 survey said they thought it was acceptable to lie about mileage to an insurer.
Key Observations
- The top three (commercial use, undisclosed drivers, and garaging location) are massive hidden exposures and often drive disproportionate losses in the riskiest 10% of a book. We dive deeper into Undisclosed Drivers here.
- Mileage understatement is also highly underestimated; frequency risk is almost linear with miles driven up to ~20k/year, then jumps.
- Telematics adoption is slowly closing the gap on factors #4 and #5.
- Carriers often catch garaging fraud and undisclosed drivers only after a claim, which is why these stay hidden in premium calculations.
The Auto Premium Leakage Problem
Undisclosed or misrepresented risk factors don’t just create underwriting headaches—they quietly drain profitability. The impact is threefold:
- Missing premium, as policies are priced lower than they should be.
- Immediate loss ratio inflation occurs as policies are written at rates far below the actual risk.
- Ongoing portfolio drag as high-risk insureds renew year after year without proper repricing.
According to Verisk, this hidden exposure represents more than $35 billion in lost premiums annually in auto insurance alone.
What’s Driving Auto Premium Leakage?
Premium leakage thrives in the gaps between what’s reported and what’s real. Two systemic issues make it possible:
- Overreliance on self-reported data at the point of sale, where mileage, usage, driver details, and more can be understated or omitted. As one carrier put it, “In many ways, applicants are essentially underwriting themselves.”
- Limitations of traditional data sources like MVRs and CLUE reports, which offer only partial visibility, aren’t always current, and can be expensive, with quality varying by market.
These blind spots open the door for the riskiest policies to slip through rating models undetected, creating a measurable and recurring profitability leak.
The Timing Problem
What makes these undisclosed risk factors particularly damaging isn’t just the loss ratio impact — it’s when they’re discovered.
The average delay between a high-risk driver beginning to operate a vehicle and being added to the policy is 13.6 months. That’s more than a year of underpriced exposure before the carrier knows about the risk. By the time the situation surfaces — through a claim, a midterm audit, or a renewal review — the leakage has already compounded.
Traditional detection methods (post-bind audits, random sampling, claim-triggered reviews) are built for a world where catching something after 13 months is acceptable. In a market where carriers are competing on speed and experience, post-bind correction is expensive, creates coverage disputes, and damages customer relationships.
The more valuable intervention point is during the application session — before the policy is issued, before the risk is on the books.
What the Numbers Mean at Book Level
Individual policy leakage looks manageable. At book level, it compounds quickly.
A carrier writing 500,000 auto policies a year with a 10% leakage rate has 50,000 policies carrying some form of undisclosed risk. If even a fraction of those policies involve the high-impact categories — commercial use, high-risk hidden drivers, major garaging misrepresentation — the aggregate loss ratio effect is material.
The compounding effect goes further: adverse selection. Carriers that are actively detecting and triaging risky applications aren’t just improving their own books — they’re routing higher-risk applicants to the carriers that aren’t watching. We’ve heard directly from carriers who said they became concerned they were getting passed the bad business from competitors further along in behavioral detection.
That’s not a hypothetical. It’s what adverse selection looks like when it’s running at scale.
Where Behavioral Data Fits In
Third-party verification catches the misrepresentations that have records. MVRs surface accidents. CLUE catches claims history. These are valuable and nobody is suggesting replacing them.
But the specific categories with the highest loss ratio impact — garaging addresses, hidden drivers, mileage, commercial use — often have no record trail at all. The first evidence of the misrepresentation is the claim itself.
Behavioral data closes that window. The way an applicant behaves when they reach the garaging address question — the hesitation, the edits, the time spent before answering — is a real-time signal that exists in every session. The applicant who removes a driver, watches the premium update, and then navigates forward without adding them back has left a behavioral trail that no database would ever contain.
Continue reading:
→ Back to the Premium Leakage Guide
→ Why Digital Insurance Created a $30 Billion Problem
→ How Behavioral Analytics Stops Premium Leakage Before It Starts
Want to see how carriers are using behavioral data to catch these risk factors in real time? Let’s talk.